meta data for this page
Analysis functions
4.1 Area
The area of all identified objects of the image is computed and displayed considering the selected unit of measurement (see chapter 6.2). The computation can be restarted by pressing the button Reset.
An image detail can be picked for a more precise analysis. Mark the desired image detail with the right mouse button keep pressed or use the menu item Edit > Cut and paste.
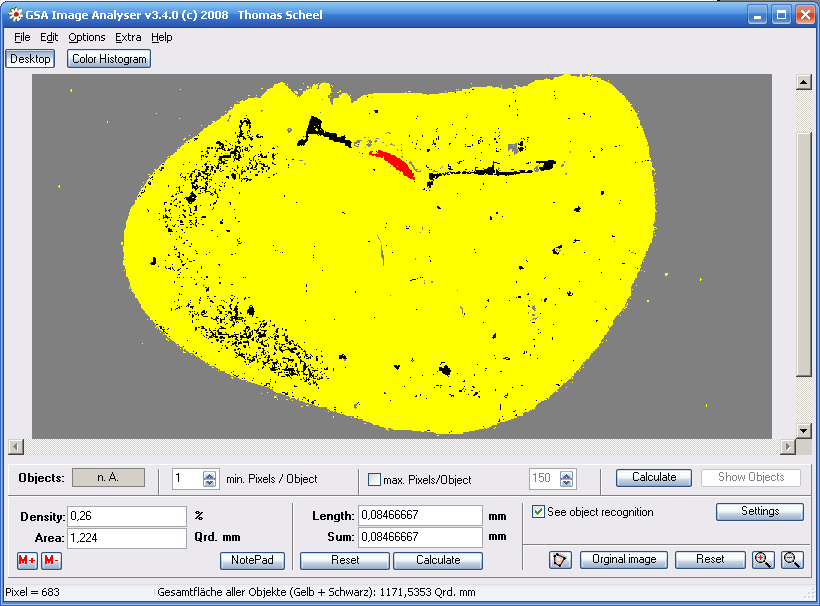
Within the representation of the applied limit values it is possible to click directly on the objects of interest. The corresponding area is computed and the selected object is displayed in another colour (Red). Furthermore the number of pixels is shown in the lower status bar. This value will be used in the process of an automatic object counting.
Additionally you have the ability to research a custom area with a free-hand-drawing tool.
Figure 13. Area computation of an object
4.1.1 Output of determined object areas according size groups
This function checks all determined object areas of the image and
arranges them according to size. To call this function please
press the key ’Calculate’ in the toolbar for object counting (see
chapter 4.4). Object areas which do not meet the specified
criterias for minimum and maximum number of pixels are not included
in the output.
Figure : Option ’Output of object areas according size groups’
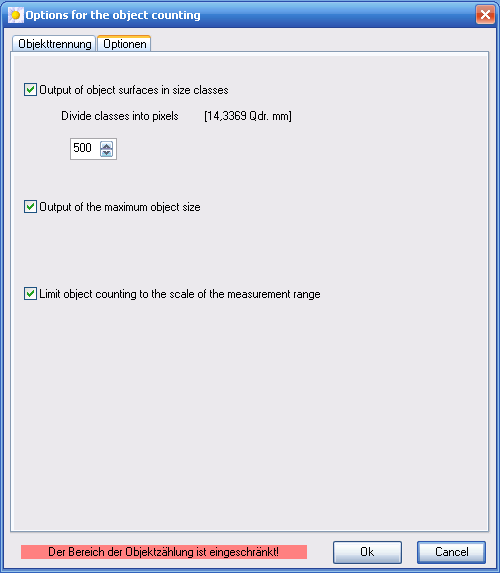
The dimensions of the used size groups are freely selectable.
For that the desired number of pixels is to be specified
(the resulting area value is displayed in brackets). The total
number of size groups then results from the largest object of the image.
For example:
Number of pixels of the largest object: 8680 pixel
dimension of classes in pixel: 500 (14,33 mm²)
18 size groups will be generated.
Figure: Output of the area analysis

4.2 Density
This function computes the proportion from object area (all identified object) to total image area. Press the button Computate (available only in mode yellow/black representation) to start this process. In general it provides the proportion from the object area ( yellow and black ) to the determined area (black). If you did mark single objects (by mouse click) then the proportion from the marked objects to the total object area (yellow and black) is provided.
4.3 Length
A manual measurement of the object length can be made by the left mouse button keeping pressed. The length of the covered line will be shown in the field Length depending on the defined unit of measurement.
All measured values will be added simultaneously in the field Total. Press the button Reset in order to reset the calculated value.
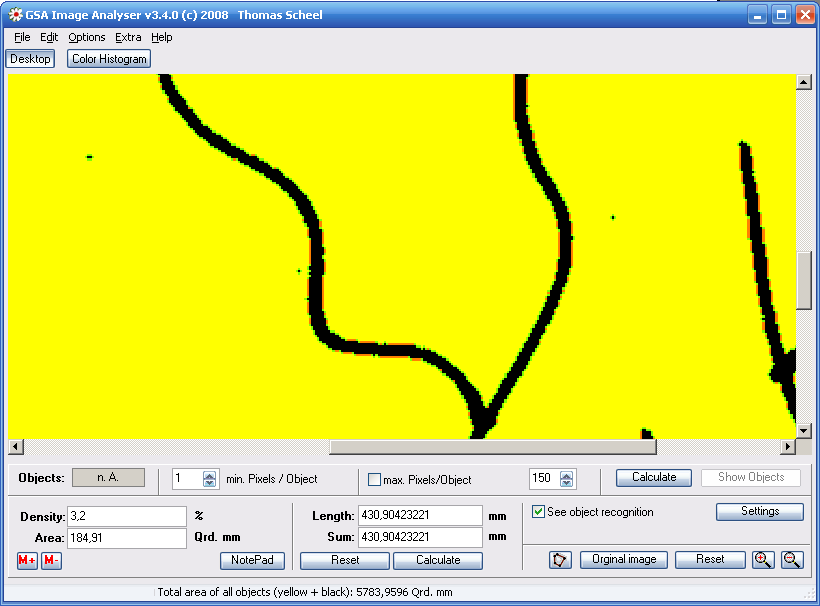
To start an automatic calculation of the length of all identified objects please press the button Calculate (only available in the yellow / black representation ). As a result you will see the contours of the corresponding objects on the image (see chapter Length determination of plant roots). Again you can use the free-hand-drawing tool for custom areas in this view.
Figure 14. Automatic object length calculation
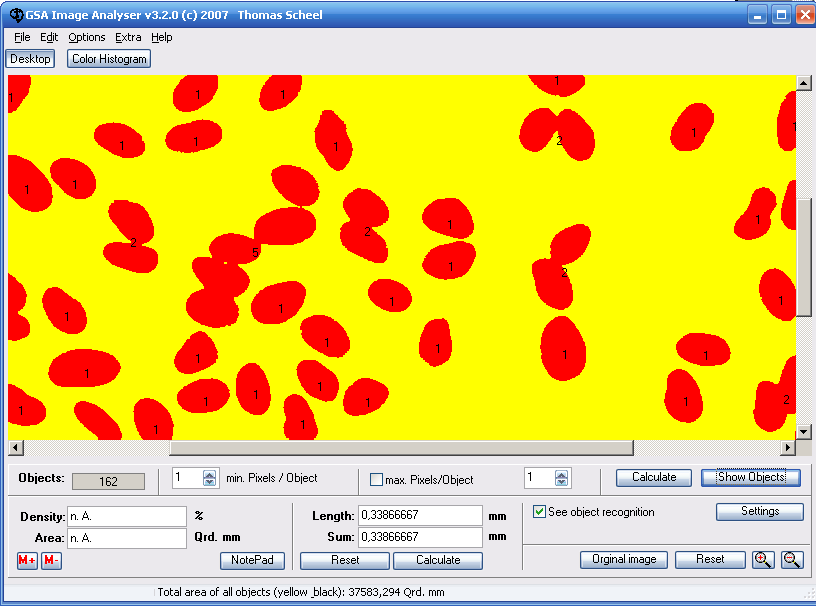
4.4 Object counting
With this function all identified objects can be counted automatically. The number of objects can be reduced by using the options Minimum number of pixels per object and Maximum number of pixels per object. Click on the single object to determine its number of pixels.
Figure 15. Object counting

This function is only available in the yellow / black representation. All counted objects can be displayed in red colour by pressing the button Show objects.
Additionally you have the ability to research a custom area with a free-hand-drawing tool.
Furthermore it is possible to restrict the counting area by using the right mouse button.
If you want to restrict the counting area permanently please select the option
“Limit object counting to the scale of the measurement range” in the menu
(Figure : Option ’Output of object areas according size groups’ Page 18).
Figure 16. Presentation of the counted objects

4.4.1 Settings for object counting of overlapping objects
The separation of overlapping object can be made by comparison of either object surfaces or intensities. In addition, there is the possibility to separate circular or ellipsoidal objects by means of object recognition.
Figure 17. Settings for object separation
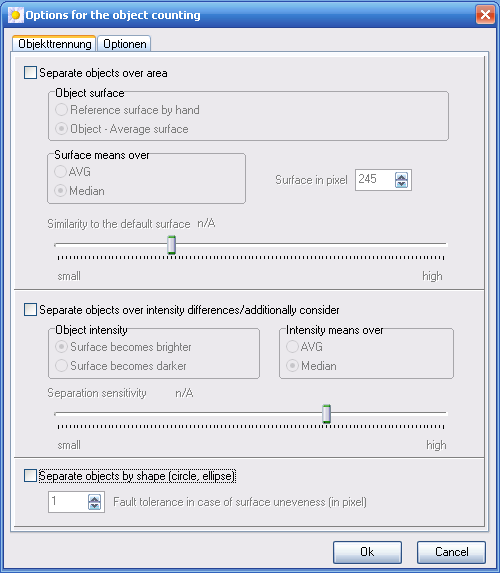
4.4.1.2 Separation of overlapping objects by object area comparison
The reference area can be specified by hand. The specification is made in pixel. It\’s best to click on the reference object within the yellow/black presentation to determine the number of object pixels and to fill it into the corresponding field automatically.
The second possibility for specifying a reference area is to determine either the average value or the median of the object areas. All objects fulfilling the conditions described in chapter 4.4 are now compared with the reference area. Whole divisors are increasing the object counter, the remainder will be treated depending on similarity defaults (sliding control).
Figure 18. Object separation by using the average value of object areas
4.4.1.3 Separation of overlapping objects by intensity comparison
Another way for counting overlapping objects is by using the object intensity. This option is available individually or combined with area separation (chapter 4.4.1.2) or object recognition (chapter 4.4.1.3). Completely overlapping objects so can be counted separately providing that the resulting intensity differs from the intensity of the single objects.
If both options (intensity and object area) are used the separation by object area comparison takes priority. This means that only objects are treated by intensity comparison which could not be separated by object area comparison. The sensitivity of the intensity comparison (total intensity of all objects, AVG and/or median) to the average object intensity can be controlled by means of a sliding control.
4.4.1.4 Separation of overlapping objects by object recognition (circle or ellipse)
Figure 18 a : Object recognition
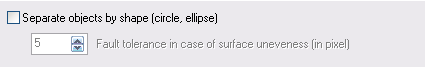
Overlapping circular objects can be identified by the detection of irregularities in object shape. A fault tolerance can be defined for small deviations (eg caused by an uneven object surface). Only after exceeding this value a deviation of the direction will be classified as a new object.
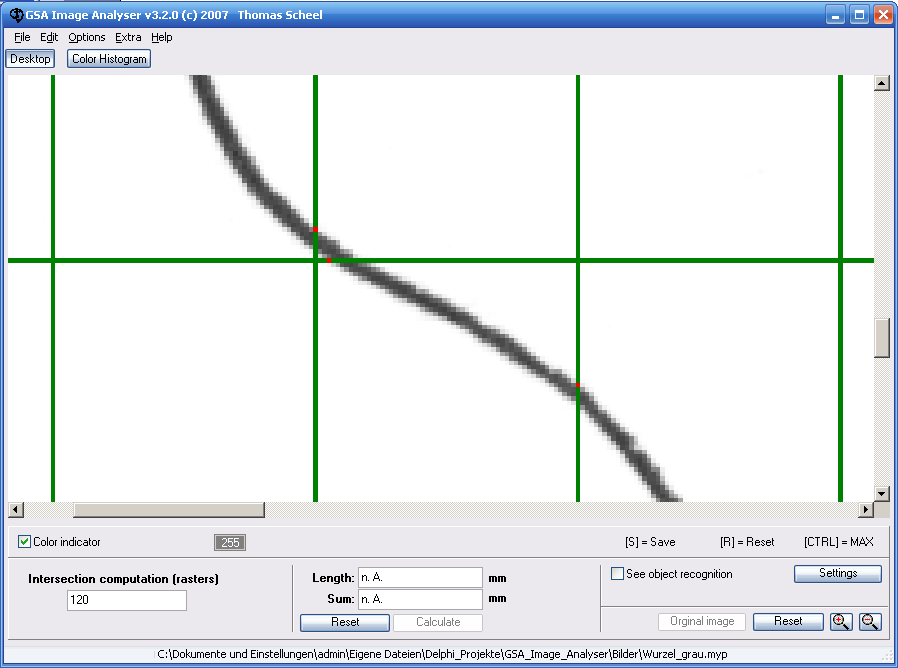
4.5 Number of intersection points with a raster
Here the intersection points of the objects with a raster are determined. The raster distance is selectable. This is used for instance for the determination of root length after Tennant.
(Tennant D (1975) A test of a modified line intersect method of estimating root length)
Switch into raster mode:
Figure 19. Selection of analysis method
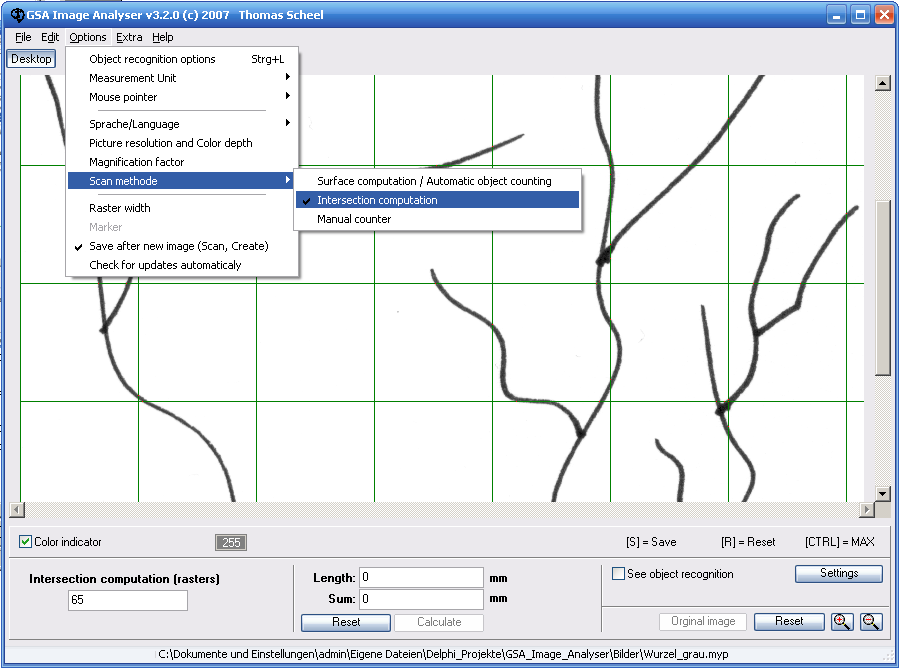
The raster parameters can be set with the menu item Options > Raster width.
The counted intersections are marked red in the raster. The raster is put automatically over the image when pressing the button Reset or with image change. The raster can be deleted by pressing the left mouse button. It is also possible to count only within a part of the image. Mark the desired part with the right mouse button (see also chapter 6.3).
Figure 20. Image with counted intersection points
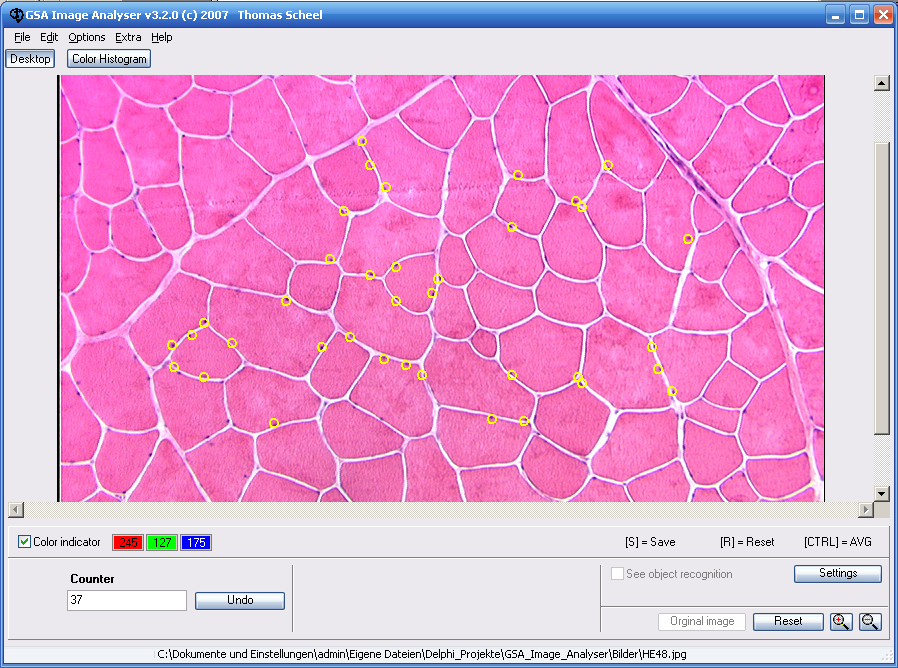
4.6 Manual counter
Here the objects can be counted manually (see also chapter 6.9).
Figure 21.: Scan method manual counter
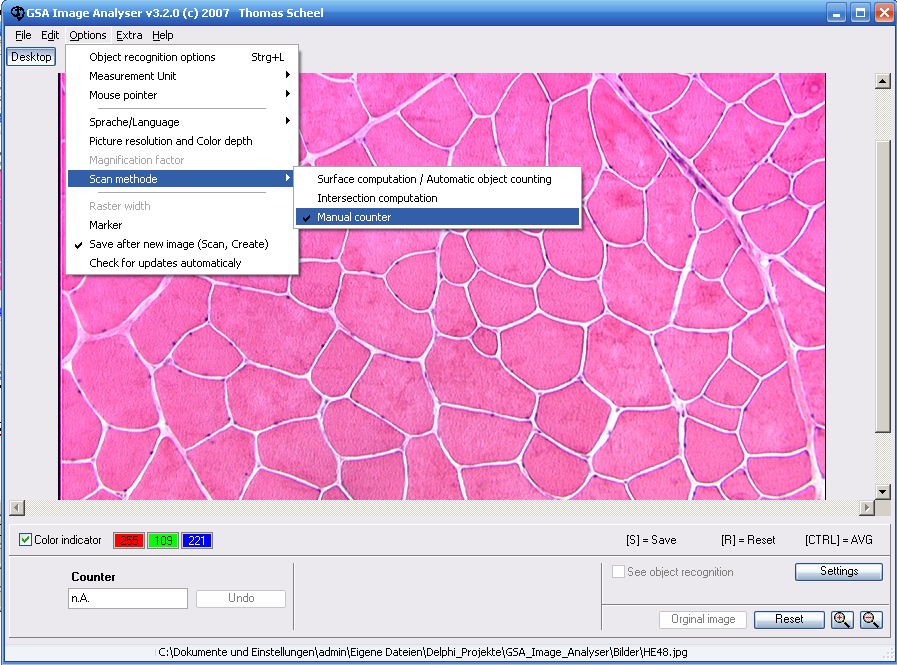
Please select Options > Scan method> Manual counter.
Afterwards you can specify the size of marking with Options > Marker. This is a circle, which is drawn around the clicked area. The colour of marking can be set over Options > Marker > Colour for marking.
With every left mouse button click the corresponding position will be marked and the counter counted up. The last counting can be reset if you press the Button Undo.
Please press the button Reset if you want to delete the image and counter.
Figure 22.: Manually counted cell nucleus