meta data for this page
Extra
7.1 Cut and count
This menu item provides a tool for the manual counting of image objects. The current image file will be divided into subframes according to the setting given in field Cut after.
Figure 28. Setting for image cutting
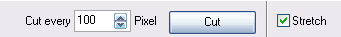
Press the button Cut in order to cut the image and to reset the counter readings.
Figure 29. Cut and count
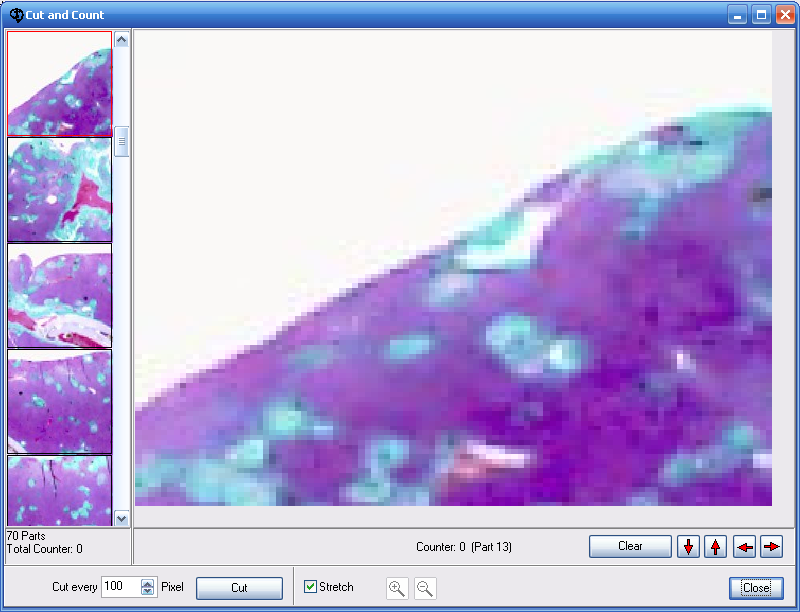
All subframes are listed in the left scrollbox. The active frame marked with a red border will be displayed on the work space.
In the example shown in figure 29 the image was cut into 15 subframes. By means of the keys 5 (forward) and 4 (back) a change of the active subframe is possible. The counter will be updated by the keys + or -.
All functions can be controlled over a popup menu.
Figure 30. Popup menu – right mouse button

Press the button Reset counter in order to reset the counter of the active subframe.

The total counter reading will be shown after reaching the last subframe.
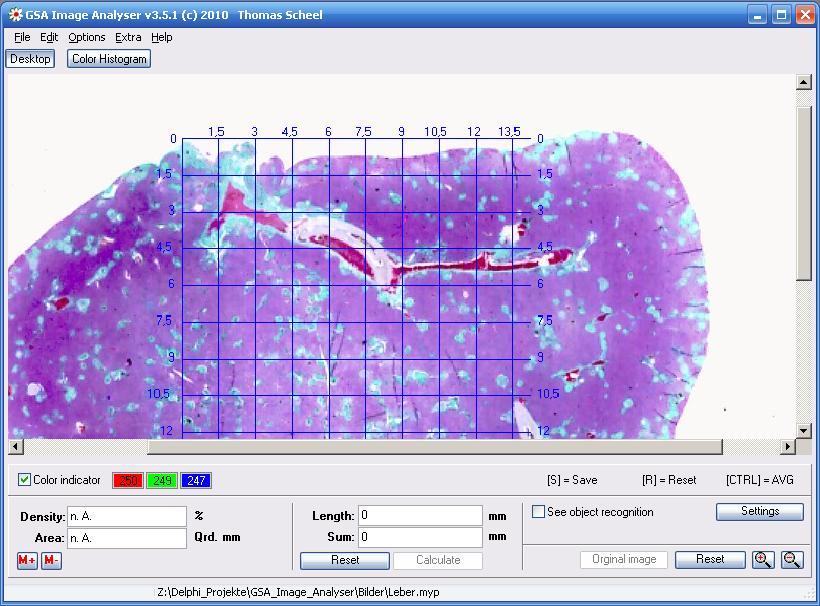
7.2 Calibrate
With the help of this function the DPI parameters can be matched with the actual proportions.
This will be necessary for instance if the magnification factor of a digital camera is unknown. An image containing a scale is needed here (see figure 31).
Figure 31. Image calibration by scale

1. Select calibration distance and unit
2. Press the left mouse button and go along the line
3. Press the button Finish
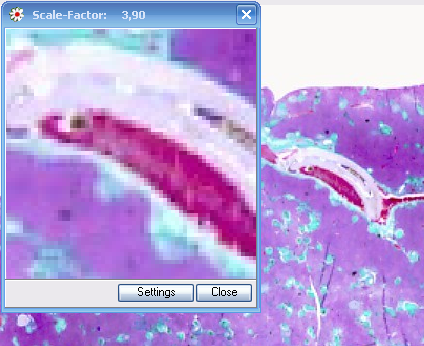
7.3 Loupe
This function will open an additional loupe window.
The magnification factor is freely selectable.
Abb.: Loupe window
7.4 Measurement Scale
A measurement scale is displayed in the opened image. Position and dimension of the scale are freely selectable. The unit and distance of the scale can be choosen by using the menu item Options → Measurement Scale.
7.4.1. Hide and unhide
With this function the measurement scale can be hided and unhided. The display of the measurement scale has no effect on any analysis functions.
7.4.2 Position
The measurement scale can be freely positioned within the main image. With the position window opened the user can define the start and end position by mouse click. To do this move the mouse to the desired starting position in the image and press (and hold) the left mouse button. Now drag the mouse to the end position and leave the hold of the left mouse button. The measurement scale will be displayed then. After closing the position window all analysis functions will be available again.
Abb.: Measuremnet scale
7.5 Color analysis
The objective of the color analysis is to pool similiar color values in groups. These groups can be taken directly into the threshold value tables for object identification respectively for the identification of object backgrounds.
Alternatively it is possible to use directly the resulting image of the selected colour groups as an input image for a new image analysis.
Figure. Color analysis
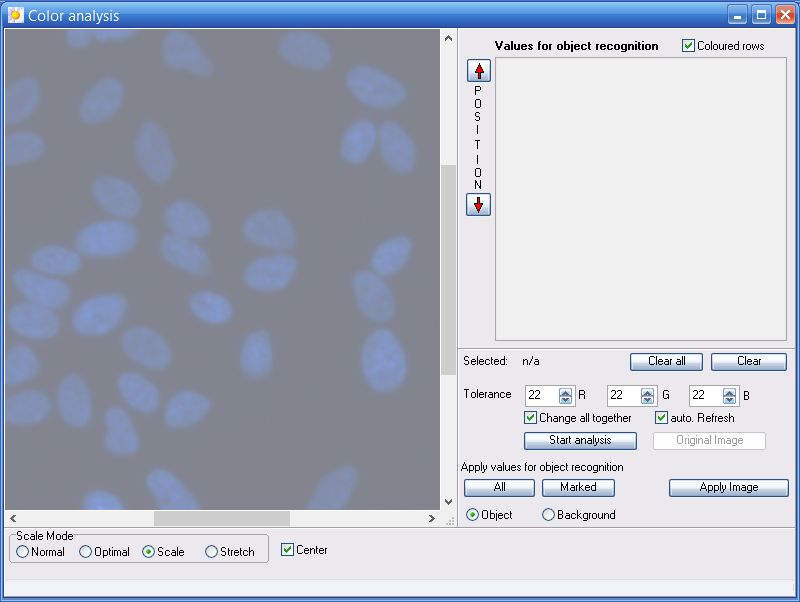
7.5.1 Tolerance
Here you can set up the maximally allowed deviation for the pixel values RGB within a pixel group. If a pixel exceeds the tolerance, a new group is opened. For the tolerance a value from 1 (minimum) to 255 (maximum) is adjustable. The larger the tolerance is, the less groups exist. At a low tolerance the analysing process takes accordingly long. With the click on the button Start analysis the proces will be started. If the checkbox auto. Referesh is activated, the analysis process is already initiated when changing tolerance . Activate the checkbox Change all together to change simultanously the tolerance values for Red, Green and Blue.
7.5.2 The result
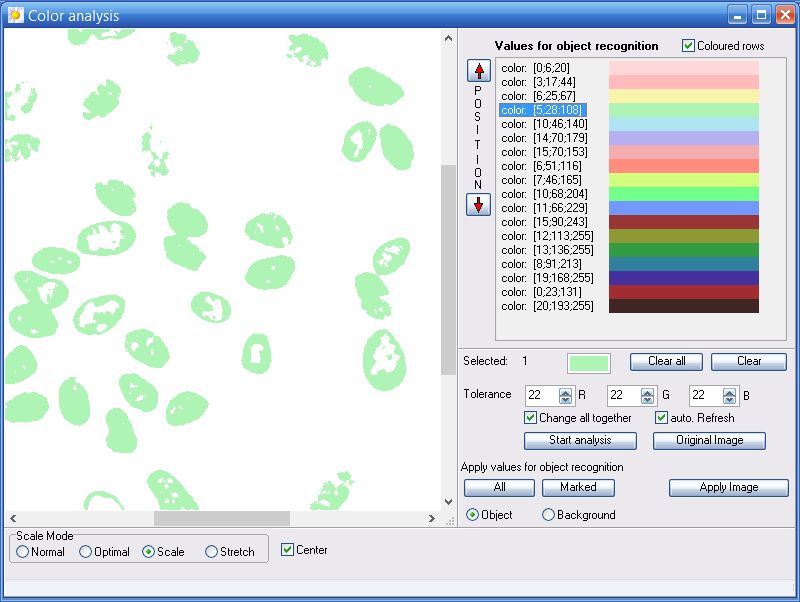
Newly created groups will be registered in the table Thresholds for object identification.
Figure. Result of the analysis

The color behind each entry corresponds to the color of the analysed image on the left side of the window. For checking purposes select one or mutltiple groups. The selected groups are highlighted in blue.
Figure. Check of a group
7.5.3 Acquisition of settings
Groups can directly be taken into the window Thresholds for object identification (see chapter 3.1). To do this, click on the button All for all groups or Marked for the selected ones. According to the settings for Object/Background all values will be transfered into the tables Thresholds for object identification and Thresholds for background identification. The corresponding window openes automatically (see chapter 3.1). Alternatively you can use the button „Apply Image“ to move the resulting image in the main program of the image analyser. Hereby a simplification of the original image can be attained.
7.6 Color proportion
Using this function the user can determine the rate of specific color pixel in the original image. Any amount of colors can be examined so.
To access this function use the menu option Extras → Color proportion or press the button “Color proportion” on the canvas color distribution.
Figure. Window Color proportion
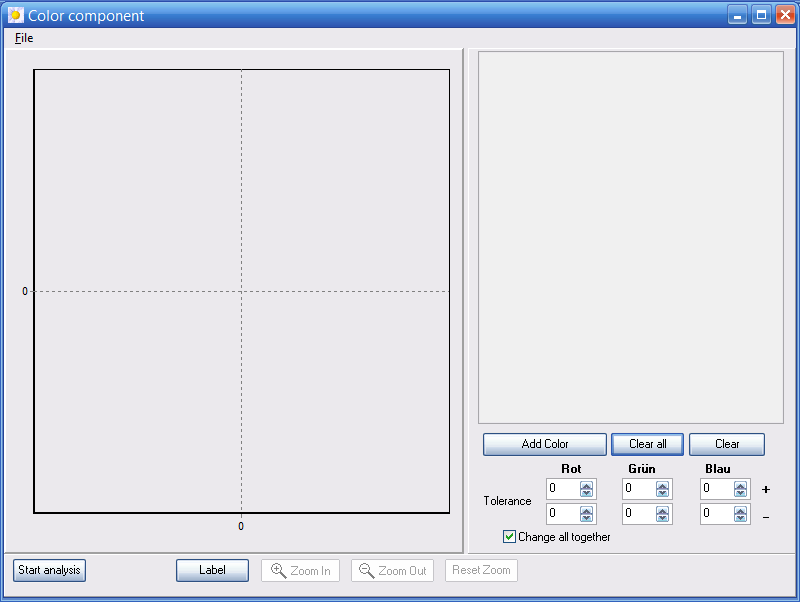
In order to select or define colors press the button „Add color“. A color palette is opened then. In this way all colors to be analysed can be registered in a table. Before registering potential tolerances should be defined by using the provided setting fields. These tolerances are individually adjustable for RGB and for any defined color value. After defining of all colors which have to be analyzed the analysis can be started by pressing the button “Start analysis”.
Figure. Window Color proportion
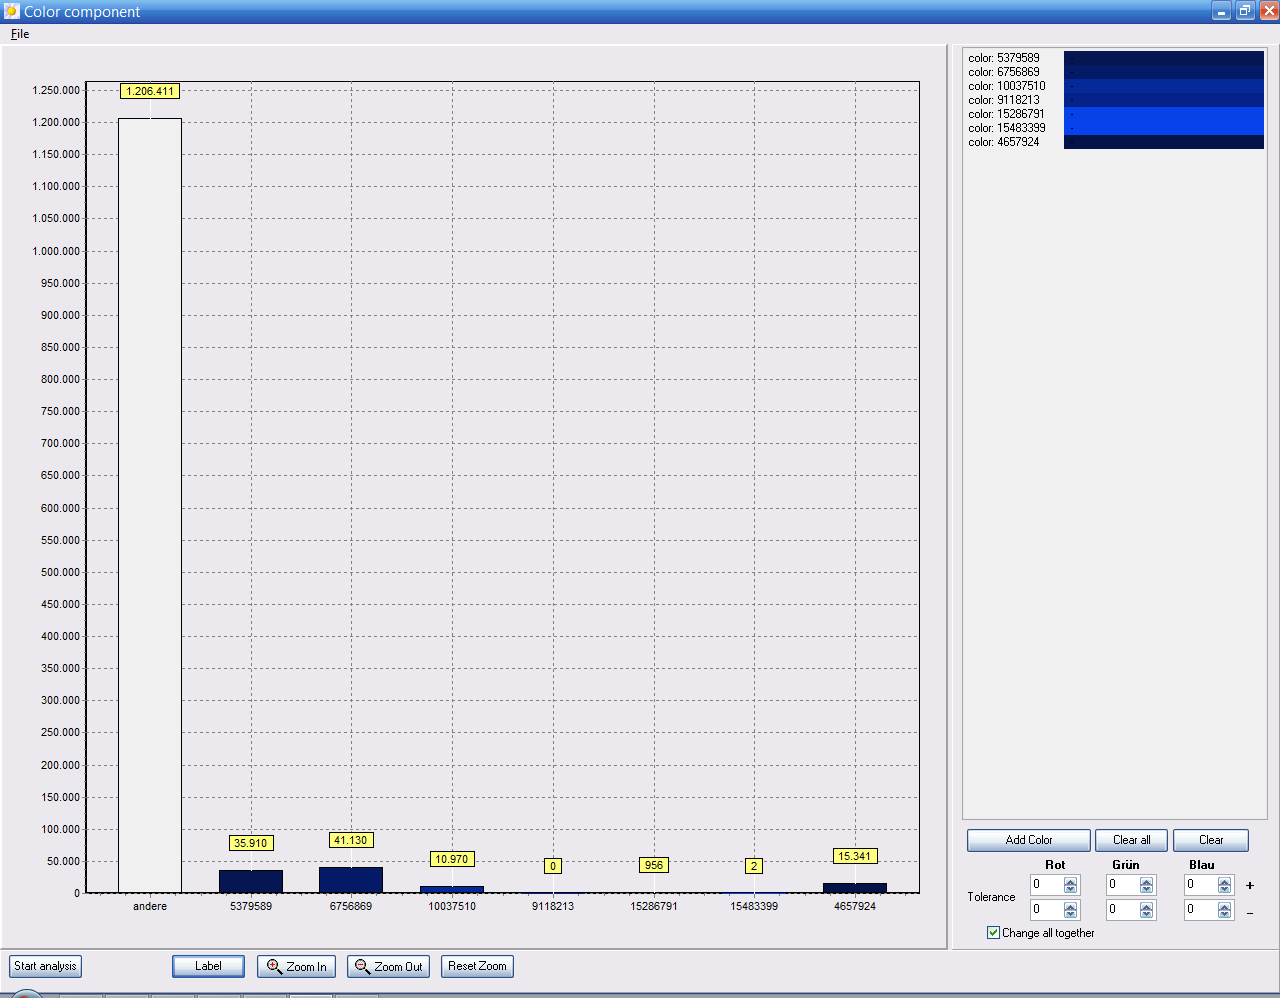
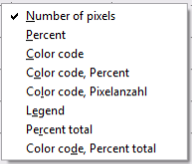
The output of the analysis can be modified via the button “Annotation” or by pressing the right mouse button within the diagram.
Figure. Window Color proportion
7.6.1 Save and Load color tables
In order to reuse the defined color table, mentioned above, for future analysis the table can be saved via the menu option File→RGB-Table→Save. Independently the current color table will be saved automatically after closing the main program and reloaded with the next program call. When loading color tables existing entries can remain in the table. The question, whether all entries are to be deleted, has to be denied then. As a special feature threshold tables can be loaded as color tables too. So it is possible to determine the number of pixels of threshold colors used for the image analysis.
7.6.2 Save the analysis result
The result of the analysis can be saved via the menu option File→Save result. The result is saved line by line for each color value that exists in the table.
The following values are written:
'filename'+tz+'colorcode'+tz+'R'+tz+'G'+tz+'B'+tz
+'tolerance_R_above'+tz+'tolerance_G_above'+tz+'tolerance_B_above'+tz
+'tolerance_R_below'+tz+'tolerance_G_below'+tz+'tolerance_B_below'+tz
+'count_pixel';
When saving to an existing file the user can decide between overwriting or appending.