meta data for this page
Settings
6.1 Limit values for object identification
All limit values for object identification determined manually or automatically for the colour and/or grey tone analysis can be managed here(see 2.3.1). The values are stored at the end of the program and loaded automatically with the next start.
6.2 Units
The following units of measurement for the output of the result can be selected : meter, millimetre, centimetre and/or inch.
6.3 Cursor and raster
When marking an image region or measuring the object length by mouse, the marked region is drawn. These markings get lost when releasing the mouse button. To show it permanently use this menu option. When counting intersection points the raster used is placed on the image. The drawing can be switched off too.
6.4 White balance
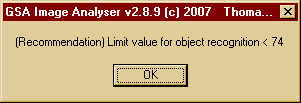
With this function an automatic image import is made by the selected device. No objects should be located on the image. The maximum values of the found pixels (grey tone) are indicated and can be used for a better definition of limit values in the process of the object identification. Ideally the value should be 255 (white) for a scanner, that means no objects (e.g. dust) was found. If the determined value should be smaller than 255, then an object identification is only possible below the measured value.
For example :
Figure 25. Recommended threshold value for object identification
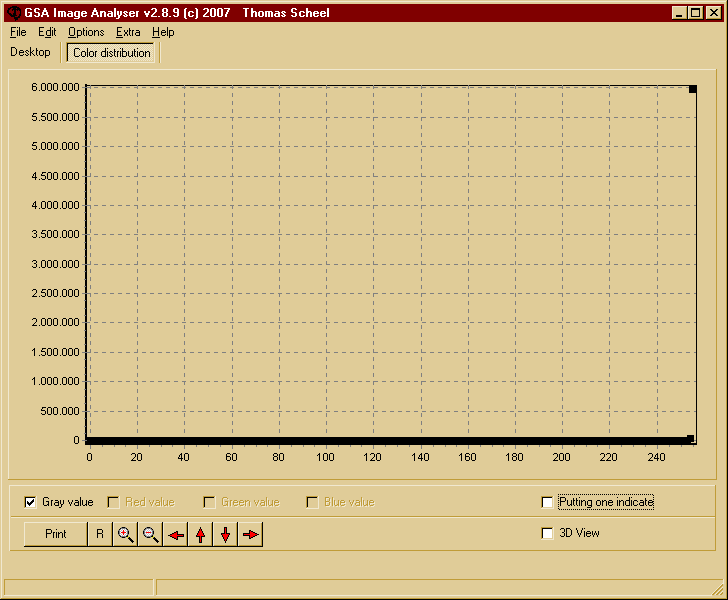
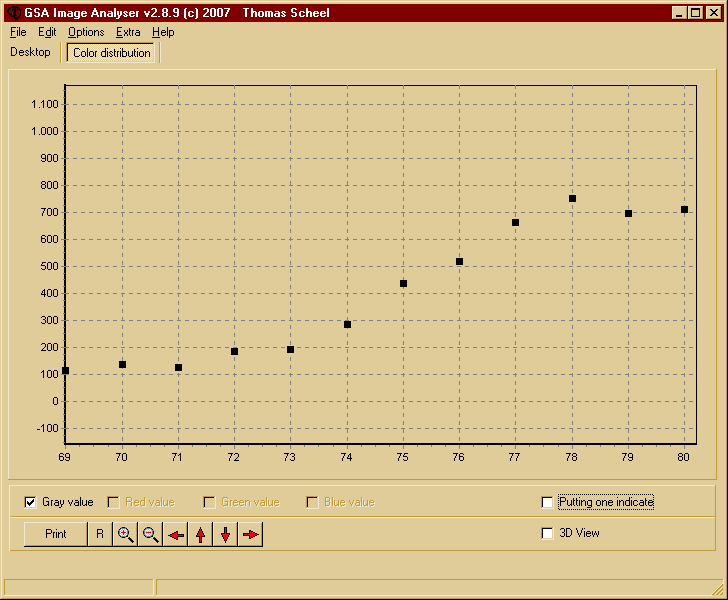
A detailed evaluation can be made by the chart of the colour distribution (see also chapter 5).
Figure 26. Colour distribution - total and a range around the grey tone 74
6.5 Language
The offered program languages are German and English.
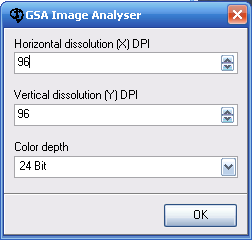
6.6 Dpi and colour depth
To set the required resolution and colour depth you can use this menu item.
When creating images by a twain interface or loading MYP images this will be done automatically. The loading of formats like BMP and JPEG requires a manual input of these values. The results of the analysis depends directly on the parameter settings for image resolution.
Figure 27. Resolution and colour depth
6.7 Magnification coefficient
The magnification coefficient as well has a big influence on the analysis results. The manual input is required if images are created by a microscope or a digital camera (see chapter 2.3).
6.8 Scan method
Use this menu item to select one o the following analysis method :
- 2D area calculation or
- counting raster intersection points (see chapters 4.1 and 4.5).
6.9 Save image data
If this option is selected, the user will be requested for saving the image date after scanning or creating. So the original image data can be stored automatically.