meta data for this page
Work space (canvas)
All images loaded or manually created are displayed on the canvas. Use the menu item Edit > Rotate 90 degrees to rotate the canvas by 90 degrees in a clockwise direction. This process can be repeated as often as the user need to.
Additional menu options Edit (canvas)
•Centre centering the image on the canvas
•Filter selection of filters for image representation
- Nearest
- Linear
- Spline
- Lanczos
- Mitchell
•Zoom for zooming in and out
•Image processing Functions for image manipulation (see section 3.3)
•Cut and paste to cut and paste a region marked by the mouse (keep right button pressed and shift mouse)
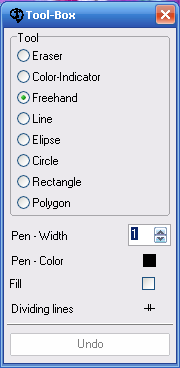
•Toolbar image editing
Figure 7. Canvas
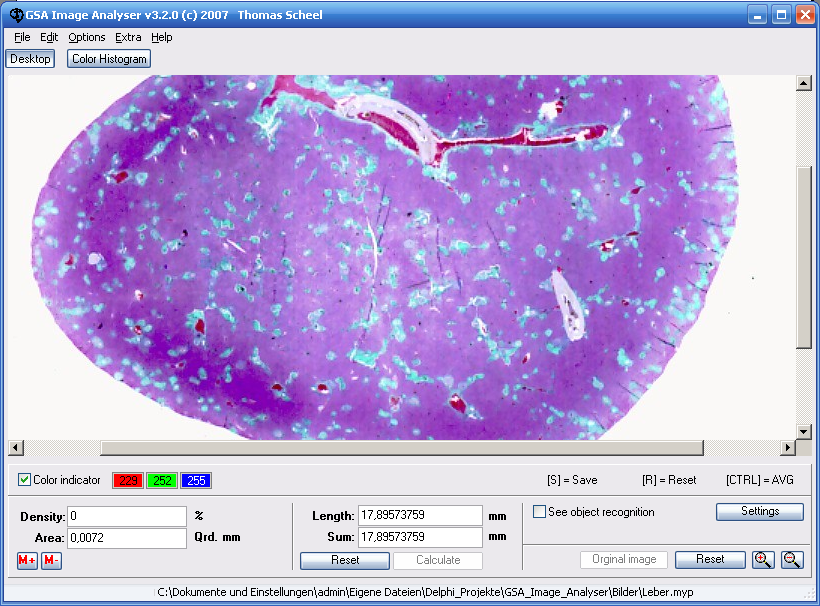
Figure 8. Toolbar
3.1 Colour indication and defining of limit values for object identification
Colour representation:
When moving the mouse pointer over an image the colour ratio of the touched pixels will be shown in the fields Red, Green and Blue. To define a colour average of the relevant pixels keep the key STRG pressed simultaneously. The automatically calculated average value will be buffered and also displayed in the fields Red, Green and Blue. Please press the key S to load the calculated average colour value into the window Limit values for object identification.
Figure 9. Average colour values and positive/negative maximum values
To apply the values shown in the fields Red, Green and Blue to the object identification you have to press the button Add ( see figure 9 ). The colour values and the reached minimum and/or maximum values are inserted into the table and are considered for the object identification. Generally it is possible to add more values here.
When moving across the object it is advisable to enlarge the image in order to avoid to cross the object edge.
Please note: Press the key R to delete all entries of the colour value buffer. So a new average colour value can be defined.
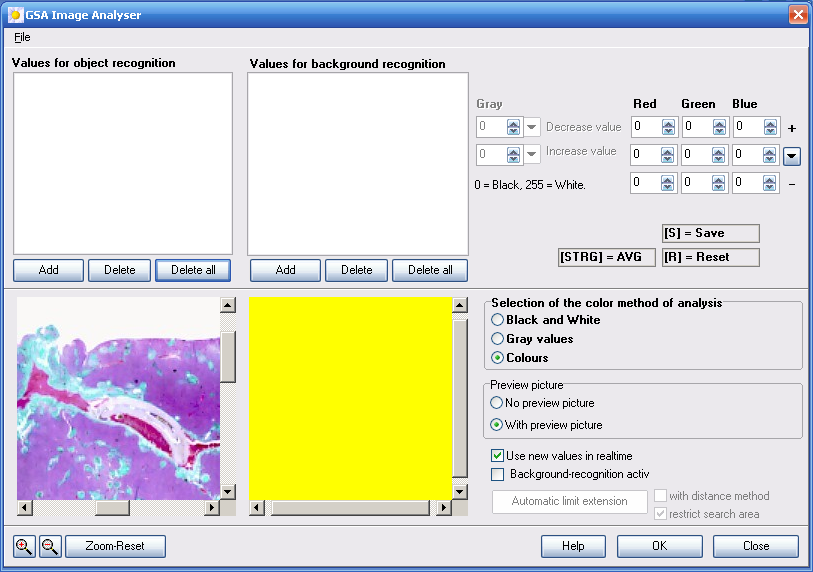
The procedure just described can be carried out also directly in the mask Limit values for object identification. Look for the desired image detail ( if necessary zoom in ), keep the key STRG pressed and move with your mouse pointer across the part of the image whose limit value have to be determined. The result will be displayed in the right window by pressing the key S ( the option Preview has to be activated before). To see the result already when moving the mouse across the image area you have to activate the option Apply limit values immediately. If the values shown in the fields Red, Green and Blue are to be used for the object identification, then please press the button Add.
Figure 10. Analysis of three image regions and determination of the corresponding tolerance values for object identification
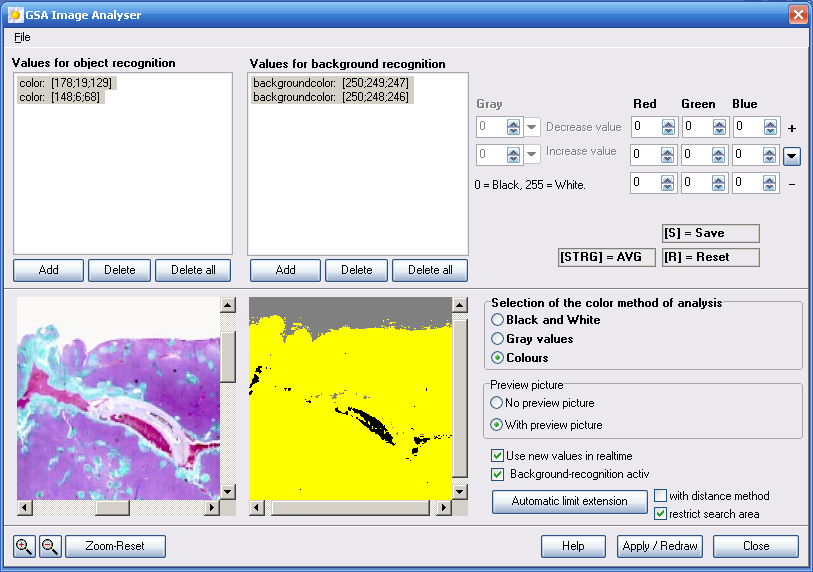
Background identification:
The determination of the entire object area requires a differentiation from background.
Proceed analogously to the method described in section Colour representation and save all determined background colour values in the list Limit values for background identification.
Automatic extension of limit values:
Please note, for this function an active background recognition is essential.
This function analyses all pixels (yellow), which could not be classified
and tries to assign it automatically to one of the two groups (object or
background). Can an assignment be made the limit values of the corresponding
group will be extended in a way that the pixel matches the group.
By activating the option “With distance consideration” also pixels can
be classified where an assignement of two colours in both groups would
be possible. In that case the choice of the group will
be made on the base of the minor distance of the third colour.
Select the checkbox “Restrict search area” in order to reduce the analysed image area of this function. In this case not the entire image will be analysed, but only the visible area in the left window. The image section can be modified using zoom and scrollbar.
Greyscale representation:
Principally the procedure is identically to those described before. Instead of the three basic colour values a grey tone is shown. Here not the colour average of the relevant pixels is determined, but the maximum value.
Figure 11. Limit value for object identification in greyscale representation
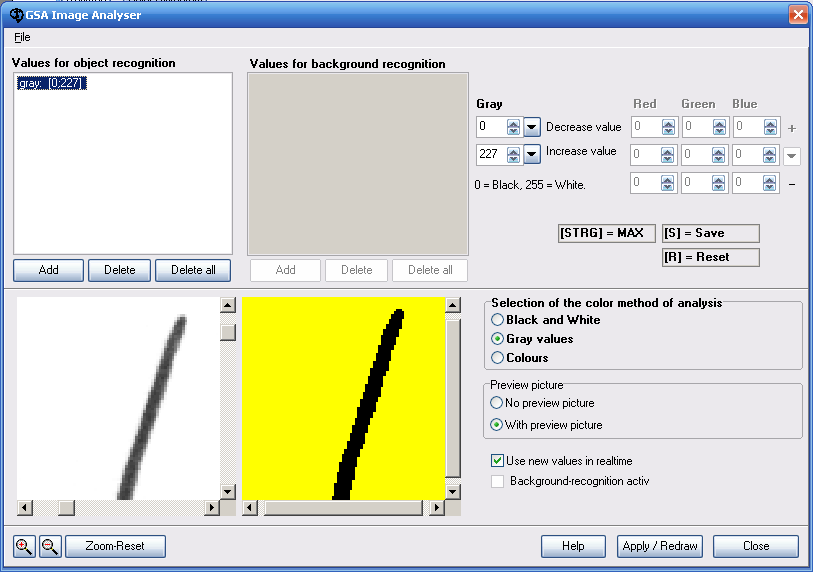
In figure 11 you can see some defined limit values for the identification of very dark (0-50) and bright (200-255) objects.
Black-and-white representations:
Only objects with a greytone of 0 (black) are identified. All other values are ignored.
3.2 Apply limit values to images
In order to apply the determined limit values (see chapter 3.1) to the image you have to activate the checkbox Apply limit values to the image. A computation process starts and the result is shown in form of a black/yellow representation. Black means, that the object could be identified and used for the analysis. To check the identified objects you can press the button Original Image or the key [O]. So you can switch between both representations (original and black/yellow) very quickly.
Figure 12. Original image and object identification
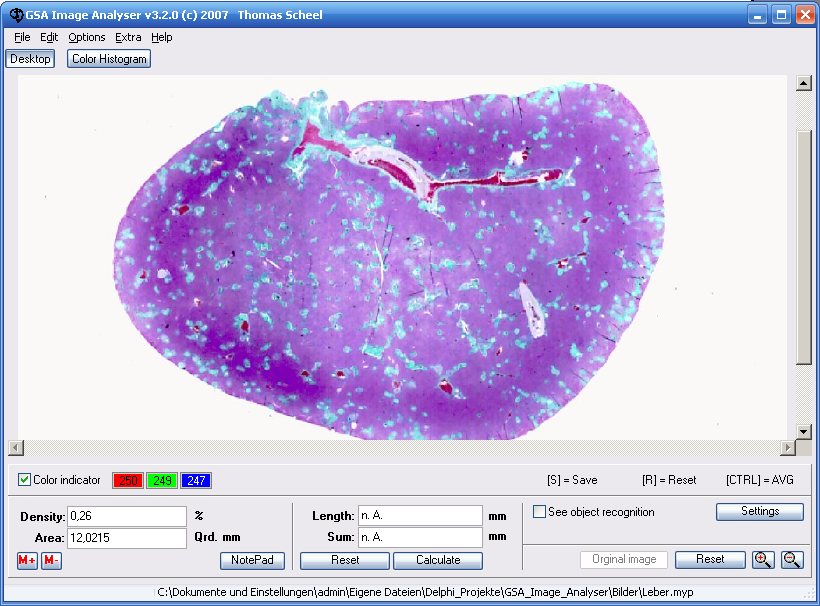
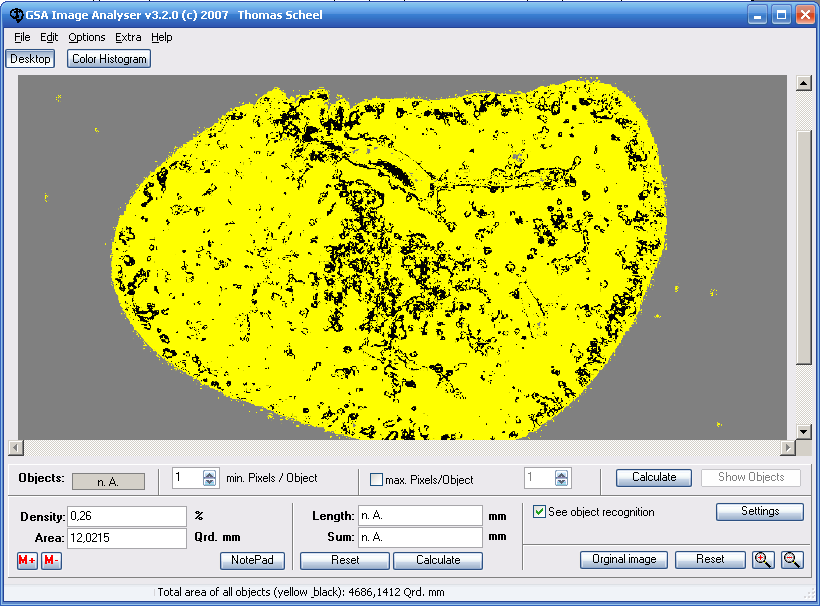
Areas represented in grey had been identified as the background. This area will not be considered for the analysis (object area computation). The total object area (yellow and black) will be schown in the lower status bar.
3.3 Image Processing
The program offers a large number of filters and functions to adapt the image optimally for an analysis.
Filters and functions:
- Uniform smoothing
- Gaussian smoothing
- Enhanced focus
- Enhanced detail
- Lighten
- Darken
- Emboss filter
- Horizontal edge detection
- Vertical edge detection
- Edge detection
- Grayscale conversion
- Black and white conversion
- Soft-drawing
- Contraste
- Sharpen
- Relief
- Blur
- Reduce colors
Figure 12.1 Image processing
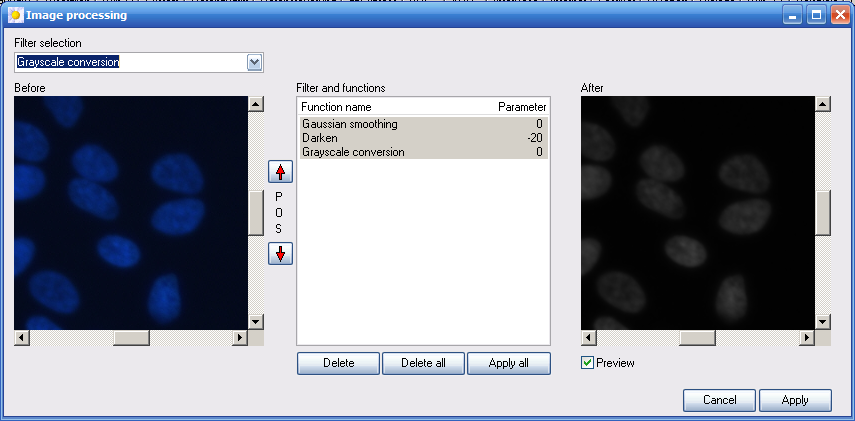
The specific filters and functions can be selected from a ComboBox. The choosen filter is entered on a list and immediately applied to the image, is Option “Preview” is enabled. Any number of filters can be selected. Even the same filter can be selected more than once.The processing of the list of filters is always from top to bottom. That means, the resulting image of the first filter will be the input image of the next filter and so on. The order of the list can be changed by using the Position-Buttons or via the Popup menu (right mouse button). If only one filter in the list is marked, the result image of this filter is shown. But any number of filters can be marked.
If the “Apply” button is pressed, all filters/functions of the list will be applied. The resulting image is provided for the main program. The list selection will than be ignored.